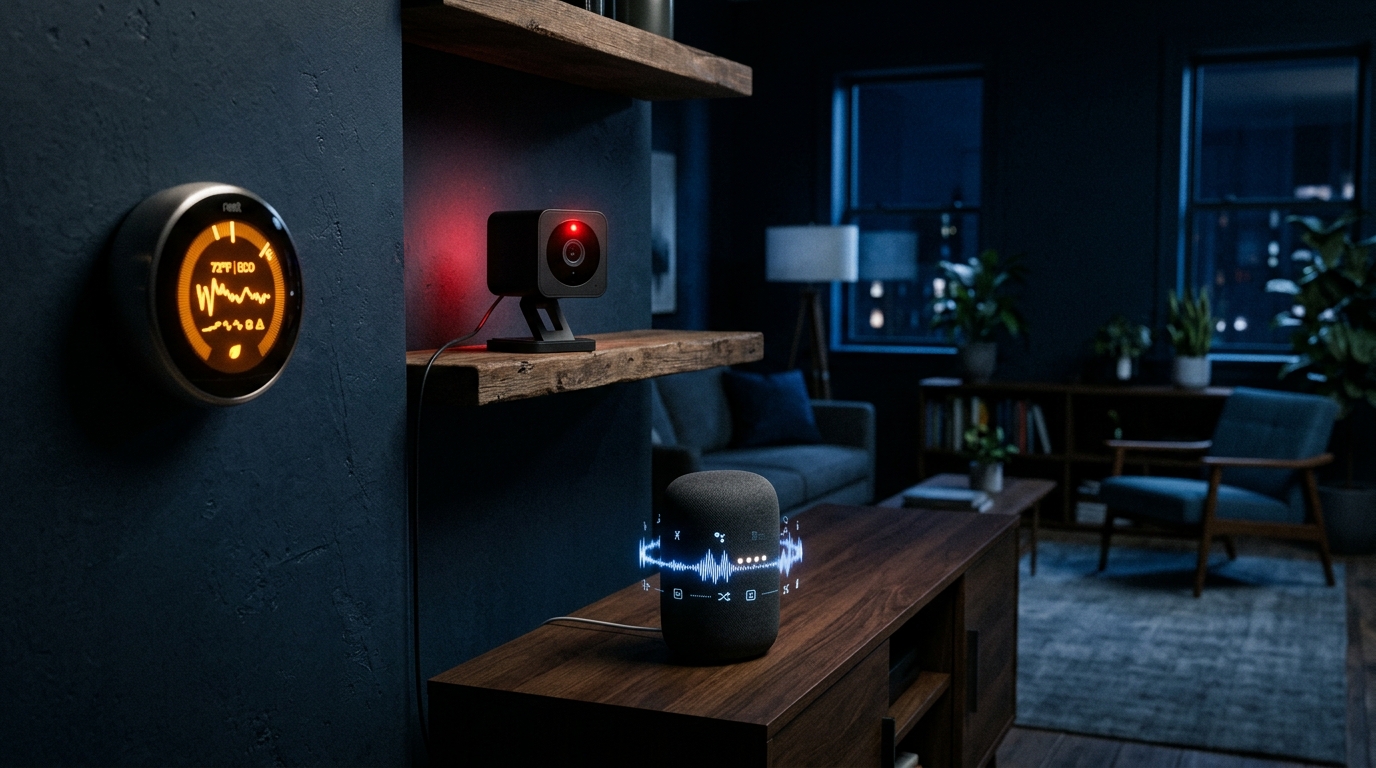
Executive Operational Telemetry: The Embedded Attack Surface
Unlike enterprise workstations backed by endpoint detection and response (EDR) agents, smart home devices are constrained embedded computers running stripped-down Linux or RTOS kernels with no local host monitoring:
- Absent Maintenance Cycles: Over 68% of commercial smart home appliances never receive post-purchase over-the-air (OTA) firmware patches, leaving zero-days and hardcoded keys open indefinitely.
- VLAN Pivot Risk: A compromised lightbulb or thermostat frequently shares the same Layer-2 subnet as personal workstations, NAS storage arrays, and mobile banking endpoints.
- Multi-Vector Signals: Compromises manifest across five distinct vectors: physical behavior, raw network traffic volume, rogue DNS queries, administrative setting tampering, and microarchitecture resource starvation.
1. Physical Anomalies and Erratic Behavior
The most visible indicator of a compromised device is unexpected physical behavior. A smart lightbulb that flickers erratically, a thermostat that spontaneously changes its ambient settings, or a security camera that pans without a direct user command are all primary signs of unauthorized access.
Cybercriminals often manipulate these devices to test their level of control or create intentional disturbances. Furthermore, hearing unfamiliar sounds or strange voices emitting from smart speakers is a critical red flag, indicating that a bad actor may be using the device's hardware to eavesdrop or communicate directly with the household.
2. Network Traffic and Bandwidth Spikes
Underneath the physical hardware, network anomalies provide the empirical ground truth for IoT compromises. A sudden surge in data usage or an unexpectedly large internet bill can indicate that a device has been recruited into a botnet. These botnets consume significant network bandwidth to launch coordinated distributed denial-of-service (DDoS) attacks, relay malicious web traffic, or communicate with remote command-and-control servers.
For a rigorous diagnostic approach, analyzing raw network traffic is essential. Unexplained data routing to unfamiliar external IP addresses suggests that the device is exfiltrating sensitive information. Utilizing intrusion detection systems like Suricata or routing traffic through a robust firewall like pfSense can clearly expose these irregular data transfers and flag unusual outbound connections before the payload is fully delivered.
An idle smart plug or light switch should generate near-zero bandwidth outside of lightweight MQTT keep-alives (sub-1 KB/min). When an edge gateway logs persistent megabyte-per-second upstream connections, the hardware has likely been repurposed as an active proxy node or DDoS cannon.
3. DNS Queries and Rogue Device Telemetry
Compromised embedded systems are highly noisy at the DNS level when attempting to phone home. Monitoring DNS requests using a local sinkhole—such as Pi-hole or AdGuard Home—can reveal a high volume of suspicious lookups originating from a supposedly dormant smart plug or appliance.
Additionally, systematically reviewing the list of connected clients on the local area network might reveal unfamiliar devices or strange Service Set Identifiers (SSIDs), which is a clear sign that someone has breached the network to exploit weak points in the smart home ecosystem.
Botnet malware frequently deploys domain generation algorithms (DGAs) to bypass static IP blocks. A Pi-hole query log inundated with non-existent domain (.nxdomain) responses or lookups for high-entropy alphanumeric strings from an embedded device confirms an ongoing C2 reconnection loop.
4. Settings Alterations and Account Lockouts
Attackers frequently modify device configurations to maintain persistent access. Unauthorized changes to camera angles, sensor sensitivity, or default operational preferences indicate that an adversary has gained administrative control over the hardware.
In more severe cases, administrators might find themselves completely locked out of their devices because the intruder changed the password or enabled two-factor authentication without consent. Receiving unprompted emails or notifications confirming changes to passwords, access permissions, or security settings is a definitive indicator of an account breach.
5. Performance Degradation and Software Failures
Because most IoT devices operate on constrained microarchitectures with limited processing power and memory, a malware infection will heavily consume these hardware resources. This manifests as slow device performance, frequent freezing, or an inability to execute basic local commands.
Furthermore, if a device experiences frequent software glitches, continuously fails to process over-the-air firmware updates, or has its built-in security features mysteriously disabled, malicious code is likely interfering with the underlying operating system.
6. IoT Compromise Diagnostic & Triage Matrix
| Indicator Vector | Observable Symptom | Diagnostic Tool | Immediate Triage |
|---|---|---|---|
| Physical & Audio | Unsolicited PTZ camera pans, ambient thermostat shifts, phantom speaker audio | Visual observation, physical power disconnect | Physical power cut; disconnect from mains |
| Bandwidth Surges | Persistent outbound flood, saturated upload pipes, unexplained ISP data caps | pfSense NetFlow, Suricata IDS, router QoS monitors | Block MAC address; isolate upstream gateway |
| Rogue DNS Beaconing | Bursts of high-entropy queries, repeated NXDOMAIN lookups, strange client IDs | Pi-hole, AdGuard Home, Zeek DNS telemetry logs | Blacklist C2 domain; restrict client DNS to sinkhole |
| Account Lockouts | Denied admin credentials, unprompted 2FA notifications, altered sensor rules | Vendor cloud portal audit, email alert logs | Hard factory reset button; revoke cloud API tokens |
| Microarchitecture Stall | Sluggish UI, unresponsive local button presses, repeated OTA update aborts | ICMP ping latency jitter, local web GUI health checks | Firmware reflash via clean USB/TFTP; VLAN quarantine |
Cross-Desk Telemetry Integration
Correlated against Suricata ET Open signature rules, Mirai/Mozi botnet C2 tracker datasets, and NIST SP 800-213 guidelines for IoT device cybersecurity integration.