The Housing Affordability Crisis: Structural Scarcity, Locked-Out Generations, and the Rental Market Squeeze
A Comprehensive Analysis — Despite moderating mortgage rates and 35 consecutive months of rent declines, the American dream of homeownership has reached an all-time low in accessibility.
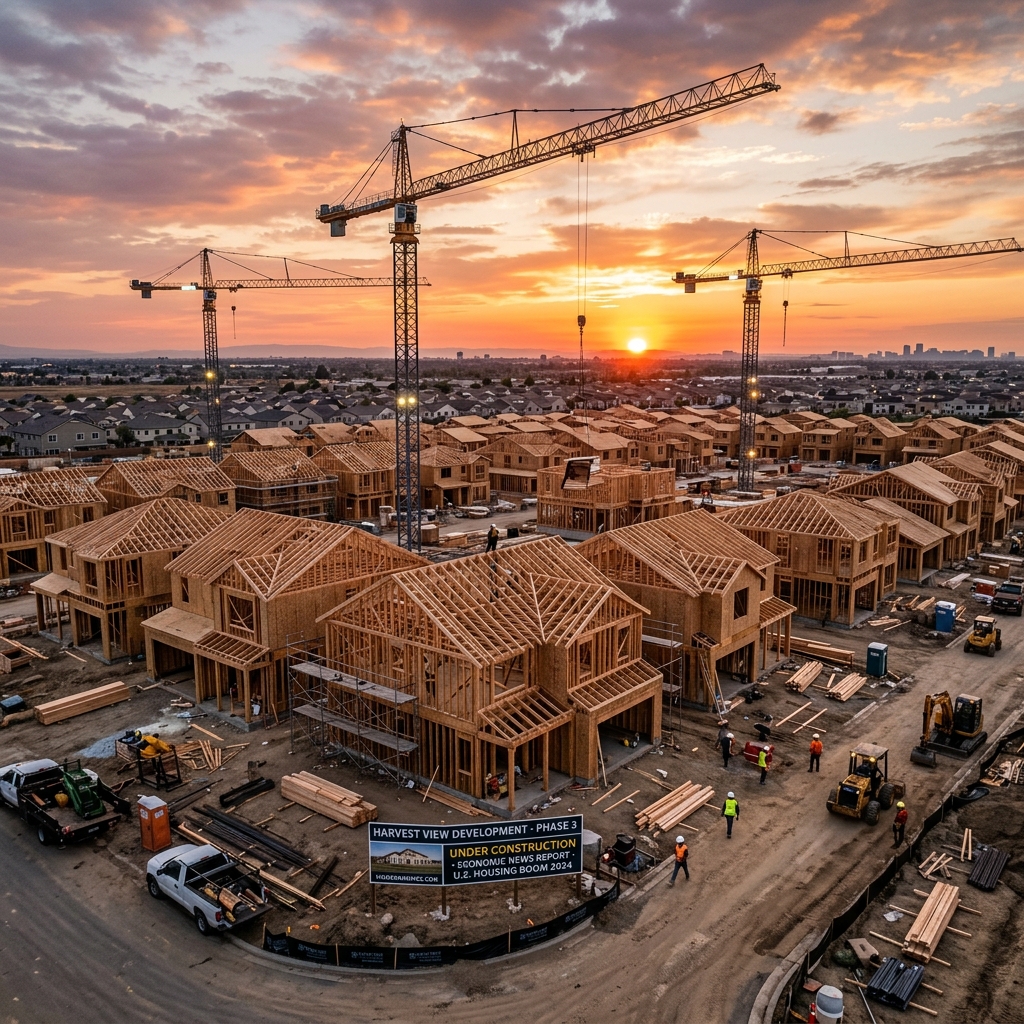
Abstract
The United States is mired in the most severe housing affordability crisis in generations. Despite mortgage rates settling into the low-6% range — roughly in line with historic norms — and rental markets recording 35 consecutive months of year-over-year declines, homeownership remains out of reach for a growing share of American households. The median existing-home price reached an all-time high of $440,600 in June 2026, requiring a qualifying income of $109,152. The national housing deficit stands at approximately 4.7 million units, the product of nearly two decades of underbuilding. First-time buyers have fallen to just 21% of the market — an all-time low — and their median age has reached a record 40. Meanwhile, 22.7 million renter households are cost-burdened, another historic high. This paper provides a comprehensive examination of the housing affordability crisis as of mid-2026, analyzing the structural supply shortage, the price-income mismatch, the mortgage rate lock-in effect, the shifting generational landscape, the rental market paradox, and emerging policy responses.
1. Introduction: The 2026 Housing Paradox
The American housing market in 2026 presents a profound paradox. On the surface, conditions appear to be improving. Mortgage rates, which averaged above 6.5% throughout most of 2024 and 2025, briefly dipped below 6% in February 2026 for the first time in nearly four years. The number of homes for sale has been steadily increasing, with inventory rising 15.2% in 2025 and projected to rise an additional 8.9% in 2026. Home price appreciation has slowed to roughly 1–2% annually, well below the double-digit increases of the pandemic era. More sellers are cutting prices and offering concessions. Rents have been declining for nearly three years. Wage growth has been outpacing inflation.
Yet for millions of Americans, the dream of homeownership has never felt more distant.
The median price of an existing home reached $440,600 in June 2026 — 49.2% higher than in June 2020 and an all-time record. The income needed to qualify for a mortgage on a median-priced single-family home was $109,152. The national housing deficit, estimated at 4.7 million units by Zillow and 4.03 million by Realtor.com, means that for every new household formed, there is simply not enough housing to absorb it. First-time buyers have fallen to 21% of the market, the lowest share on record, and their median age has climbed to 40 — up from 29 in 1981. Across the country, 22.7 million renter households are cost-burdened, spending more than 30% of their income on rent and utilities.
This is not a cyclical downturn. It is the cumulative result of structural forces that have been building for nearly two decades: chronic underbuilding since the 2008 financial crisis, restrictive zoning that limits density in high-opportunity areas, a mortgage rate lock-in effect that has frozen existing-home supply, demographic shifts that have increased housing demand even as household sizes shrink, and construction costs — labor, materials, land, and regulatory compliance — that make it economically unviable to build homes affordable to middle-income buyers without subsidy.
2. The Structural Supply Shortage
2.1 Two Decades of Underbuilding
The root cause of the housing affordability crisis is straightforward: the United States has not built enough homes to keep pace with household formation for nearly two decades. The St. Louis Federal Reserve documented in April 2026 that building permits per capita stood at just 4.3 per 1,000 people in 2024 — 35% below the 1960–2000 historical average of 6.6 and 59% below the 1972 peak of 10.6 (Garcia & Garriga, 2026).
The collapse was triggered by the 2008 financial crisis. Total permits fell from 7.3 per 1,000 in 2005 to just 1.9 per 1,000 in 2009 — a 74% decline and the lowest level since data collection began in 1960. The construction workforce never fully recovered; many workers left the industry permanently, and fewer young workers entered the trades. As of December 2025, the government reported nearly 300,000 job openings in construction, and the NAHB estimates the residential construction sector needs to add roughly 740,000 workers annually just to keep pace with growth, retirements, and departures.
The cumulative result is a housing deficit of approximately 4.7 million units, according to Zillow's July 2026 analysis. Realtor.com's estimate, using a slightly different methodology that incorporates pent-up demand from young households, places the gap at 4.03 million homes as of 2025. The Harvard Joint Center for Housing Studies' State of the Nation's Housing 2026 report confirms that "sales of existing homes sit at three-decade lows" and that "home price-to-income ratios remain near record highs."
2.2 The Geographic Concentration of Scarcity
The housing deficit is not evenly distributed. Zillow's July 2026 metro-level analysis reveals that the most severe shortages are concentrated in the nation's most expensive and economically dynamic markets:
| Metro Area | Unit Deficit | % Listings Affordable to Median Income | Status |
|---|---|---|---|
| New York, NY | 405,956 | 13.8% | Severe Shortage |
| Los Angeles, CA | 344,533 | 5.1% | Acute Crisis |
| Boston, MA | 147,028 | 14.8% | Severe Shortage |
| San Francisco, CA | 132,116 | 15.9% | Severe Shortage |
| San Diego, CA | 97,465 | 10.2% | Severe Shortage |
| Buffalo, NY | Balanced | 61.4% | High Affordability |
| St. Louis, MO | Balanced | 59.1% | High Affordability |
| Detroit, MI | Balanced | 55.9% | High Affordability |
2.3 The Construction Outlook
The near-term construction outlook offers little hope for rapid improvement. NAHB's February 2026 forecast projects single-family starts will increase just 1.0% in 2026 to 940,000 units, with multifamily starts actually falling 5% to 392,000 units. Zillow's forecast is even more pessimistic, projecting 2026 as the slowest year for single-family construction starts since 2019.
Builders face a confluence of headwinds: persistent labor shortages, elevated material costs (price growth above 3% since June 2025), tariff uncertainty on construction inputs, and softening buyer demand at current price points. Realtor.com estimates that even if building increased 50% from the 2025 pace and pent-up demand fully dissipated, it would take roughly seven years to eliminate the current deficit.
3. The Price-Income Mismatch and Rate Lock-In
The relationship between home prices and household incomes has fundamentally broken. Since 2019, home prices have risen 53%, while median household income has risen only 24% (NAHB, 2026). The St. Louis Fed documented that median home prices have increased roughly 207% since 2000, while per-capita incomes rose only 155% over the same period.
The NAR's Housing Affordability Index shows that the income needed to qualify for a mortgage on a median-priced single-family home ($446,400) was $109,152 in June 2026, assuming a 20% down payment and the average 30-year fixed mortgage rate of 6.57%. Affordability has been sliding for five consecutive months.
The Mortgage Rate Lock-In Effect
During the pandemic, millions of homeowners secured mortgages below 3% to 4%. Roughly 80% of outstanding mortgages still carry a rate of 6% or lower, and nearly 70% remain below 5%.
A homeowner with a 5% mortgage who sells and purchases with a new $400,000 loan at 6.5% incurs an immediate $381 monthly penalty. For sub-3% holders, the monthly increase exceeds $800, effectively freezing existing-home inventory.
4. The Generational Lockout: Delayed Wealth Building
First-time buyers made up just 21% of the market in 2025 — an all-time low, down from 44% in 1981 and well below the historical norm of ~40% (NAR, 2026). Their median age reached a record 40 years old, up from 29 in 1981.
NAR estimates that delaying homeownership until age 40 — instead of 30 — results in losing approximately $150,000 in equity on a typical starter home. Homeownership remains the primary vehicle for generational wealth creation in the United States, widening long-term wealth disparities.
Realtor.com estimates that 1.82 million potential Gen Z and Millennial households were "missing" in 2025 — young adults who would have formed independent households under balanced conditions but remain living with family or roommates due to prohibitive rent and purchase hurdles.
5. The Rental Market Paradox: Record Cost Burdens Amid Falling Rents
June 2026 marked the 35th consecutive month of year-over-year rent declines for 0–2 bedroom properties across the 50 largest metros, with national median asking rent at $1,692 — down 1.5% from a year earlier and 4.1% below the August 2022 peak.
Yet the number of cost-burdened renter households hit an all-time high of 22.7 million (49% of all renters) in 2024 (Harvard JCHS, 2026). In Dallas–Fort Worth, closing the low-income housing gap at current construction rates would take 474 years; in New York City, 169 years; and in St. Louis, over 900 years.
6. Policy Responses & Strategic Outlook
On July 11, 2026, the federal 21st Century ROAD to Housing Act was signed into law, introducing incentives for local density zoning reforms, expanding financing frameworks, and restricting bulk single-family acquisitions by large institutional investors. State-level supply reforms — such as Texas's SB 15/840 and Columbus, Ohio's "Zone In" initiative (enabling 88,000 units) — offer a viable roadmap for structural relief.
Conclusion: The housing affordability crisis is fundamentally a supply crisis. Demand-side subsidies provide temporary margin relief, but only broad-based zoning deregulation, construction workforce expansion, and accelerated modular building can restore generational access to shelter.